I bet day to day most people use the built in direct debugger in your IDE. You press a button and everything is done for you. This won't help you if the start up configuration is non trivial, in the case of weblogic for example where you have to run a script, or the process has to run on another machine. In the remote section there are a number of options that are pretty interesting as far as dealing with certain corner cases. I had cause to use some of them recently to track down a particularly hard to reproduce bug and realized that some are actually applicable to day to day work.
All the screen grabs are from JDeveloper; but the concepts should work equally well with other tools.
Normal remote debugging.
JDeveloper at least doesn't come with a remote run profile configured by default but it is really quick to set one up from the project properties dialog. In the Run/Debug/Profile configuration page create a new entry:
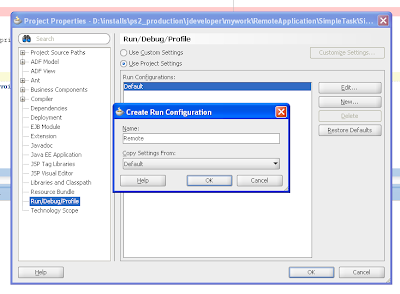
Then edit the properties so that JDeveloper knows you are doing remote debugging:
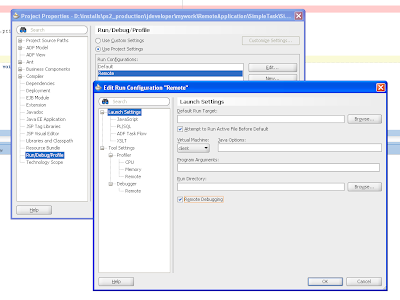
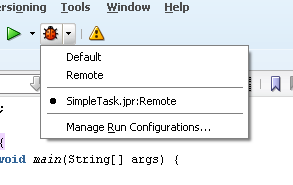
Then you can select this profile to debug:
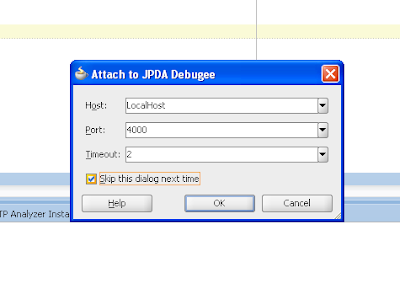
The first time the debugger runs you will see this connect dialog, for most local debugging work the settings can stay the same so check the box so you don't get asked each time. You might want to consider increasing the timeout a little bit for convenience.
So you need to run your java process with the, erm, simple command line option as follows. Not the easiest to remember string; but I guess "alias" is your friend.
java -agentlib:jdwp=transport=dt_socket,server=y,address=4000 ...
Right so that is the basics, lets try some of the more interesting options.
Start and connect later
In the default mode for the debugger the debuggee process won't start until until the IDE tells it to, and will quit when the debugger stops. This is really annoying if you are trying to debug a remote instance of weblogic server and want to keep it running between sessions. (For example if you configured another server to use instead of the integrated one, I am looking at you Chris Muir) Or if you forget to start the debugger and everything is just sitting there waiting for you to wake up.
So you can use the "suspend=n" flag, this means that the target task will start; but allow you to connect a debugger later:
java -agentlib:jdwp=transport=dt_socket,server=y,address=4000,suspend=n ...
You run the remote debugger in the normal way; but when you "Stop" the debugger you now have a choice to either let the process continue running or to kill it:
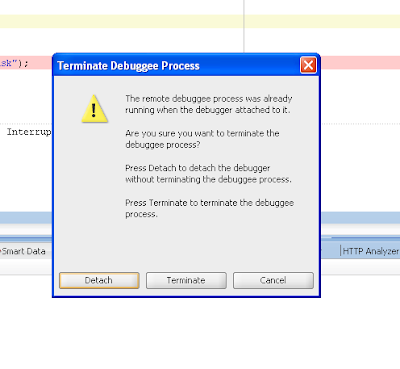
This allows you to leave infrastructure running, most like a server, whilst still be able to connect on demand to debug.
Have debugger always running, get the debuggee to connect back
The previous two configurations both require at least two step processes for each debugging session. You have to start the debugger and debuggee. This can be really annoying particularly if you are trying to debug a hard to reproduce problem that requires the target VM to be stopped and started many times.
Luckily there is a setting that allows the debuggee to connect to the debugger at start up. The debugger on the IDE only needs to be started once to listen for events. This takes a bit more to set up so lets start at the IDE end and create a new Run/Debug/Remote entry:

In the properties for "Remote - listener" change to be a JPDA listener rather than the normal attach mode:

Also set the timeout to zero so it listens for-ever and use a different port so that it won't clash with normal debug sessions. (Minor mistake in screen grab, the combobox is showing the wrong value use the value in the previous grab)
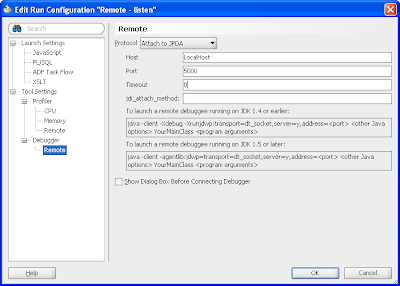
Now you just have to run this profile in the normal way, and instead of the debugger starting you should see this listener active in the Run Manager.

So the next step to to run the task you want to debug notice the server flag has changed and we have specified the new port:
java -agentlib:jdwp=transport=dt_socket,address=localhost:5000,server=n ...
In JDeveloper the debugger will start up and then run in the normal way:
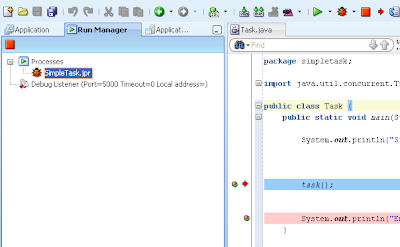
You can start multiple sessions at the same time with difference instances of the program you are trying to debug. It can get kind confusing though. It does mean that starting the debuggee is a one step process which seems to save me some vital thinking seconds that I could be applied to the problem in hand.
At some point you may wish to shut down the listener, for completeness you can do this from the run manager:

This is the mode that I am finding a valuable time saver day to day. It might only save a few seconds on each run; but over the last week it has proven to be a real time saver. Of course this is very dependent on just what and how you are debugging on whether you will find this useful.
More details
For more details on the debugging options that a look a this


No comments:
Post a Comment