If you have programmed in Java for a long time you will probably have ended up in a debugger session with an exception class that either some other person has failed to log or just never get traced out before and another exception is thrown. Now you could just modify the code to put in a printStackTrace; but these can be forgotten which is a real pain when they end up in the production code. I ended up wondering if it was possible to get JDeveloper's debugger to display a little bit more information. Turns out you can.
What you need to do is to set up the "Object Preferences..." for the given type. The easiest way of doing this is to right click on a field in the debugger's data window. By default the combo box will display the settings for the "current" exception; but we want to make this change work for all exceptions so drop this down and then select "Throwable".
Now in the "What to show..." section select the expression check box and add the string "getStackTrace()". Note it has to use the method and not the field as this information is fetched lazily. When you have finished the dialog should look something like this:
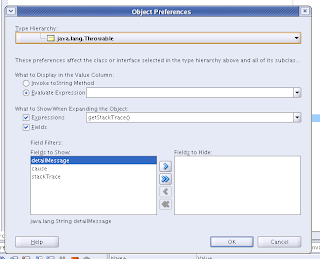 Right so you should now see all the stack trace elements appearing under the exception node, the thing is that this doesn't really give you any useful information. To do this you need to make sure that the preferences for StackTraceElement are correct. If you take a look at the next screen grab you will see that I have set the "What to display..." section to use toString():
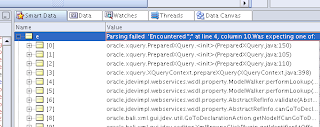
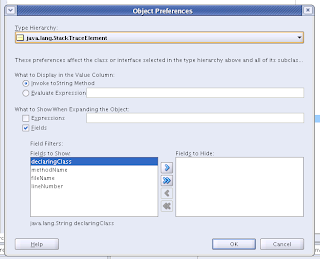 You should now see something like the following the debugger data window
 This was kind of promising so I decided to take a look at whether I could improve the debugger information displayed when working with DOM elements. You might find, that specially when working with Oracle's XDK, that the information provided to you in the debugger is less than usefull. You cannot easily for example examine a list of child nodes. This proved to be a little bit harder to display in the debugger as you have to get the debugger to understand the class "org.w3c.dom.NodeList". Turns out that you can happily call static method on other classes. I happened to have a method that converts a NodeList into an array of Node instance that looked like this:
 public static Node[] convert (NodeList list)
 {
   Node nodes[] = new Node[list.getLength()];
   for (int counter = 0; counter < list.getLength(); counter++)
   {
      nodes[counter] = list.item(counter);
   }
   return nodes;
 }
And it turned out to be a simple matter to plug this into the debugger:
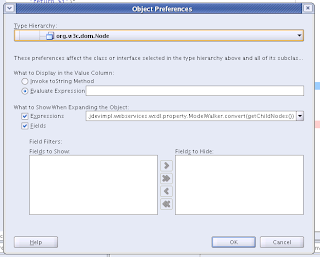 And here are the results shown in the data window:
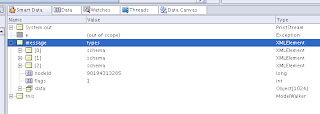 You could of course take this further an change the convert method so that it returns a structure with more information in it, such as what is the parent of the current element. Or indeed add methods to your objects to provide this information at debug time.
So this all sounds like fun, so what is the downside? Well it does make the debugger run a little bit slowly; but otherwise it does seem to be a win for programmer productivity.
Note this is a retread of a previous blog posting; but I think it makes sense to republish it as there is a now a public release to try this with.

No comments:
Post a Comment